Support, Resistance, and Supply-Demand Zones Without Confusion
Learn how to mark support and resistance with clean rules and use supply-demand zones without drawing every chart into a rectangle mess.
March 23, 2026 · 3 min read · by ChartzPayTheBillz
TL;DR: Support and resistance are reaction areas where price has historically changed behavior; supply-demand zones are stronger contextual blocks tied to imbalance and displacement. Mark fewer, higher-quality levels and prioritize zones that align with structure and liquidity.
What Are Support and Resistance Zones?
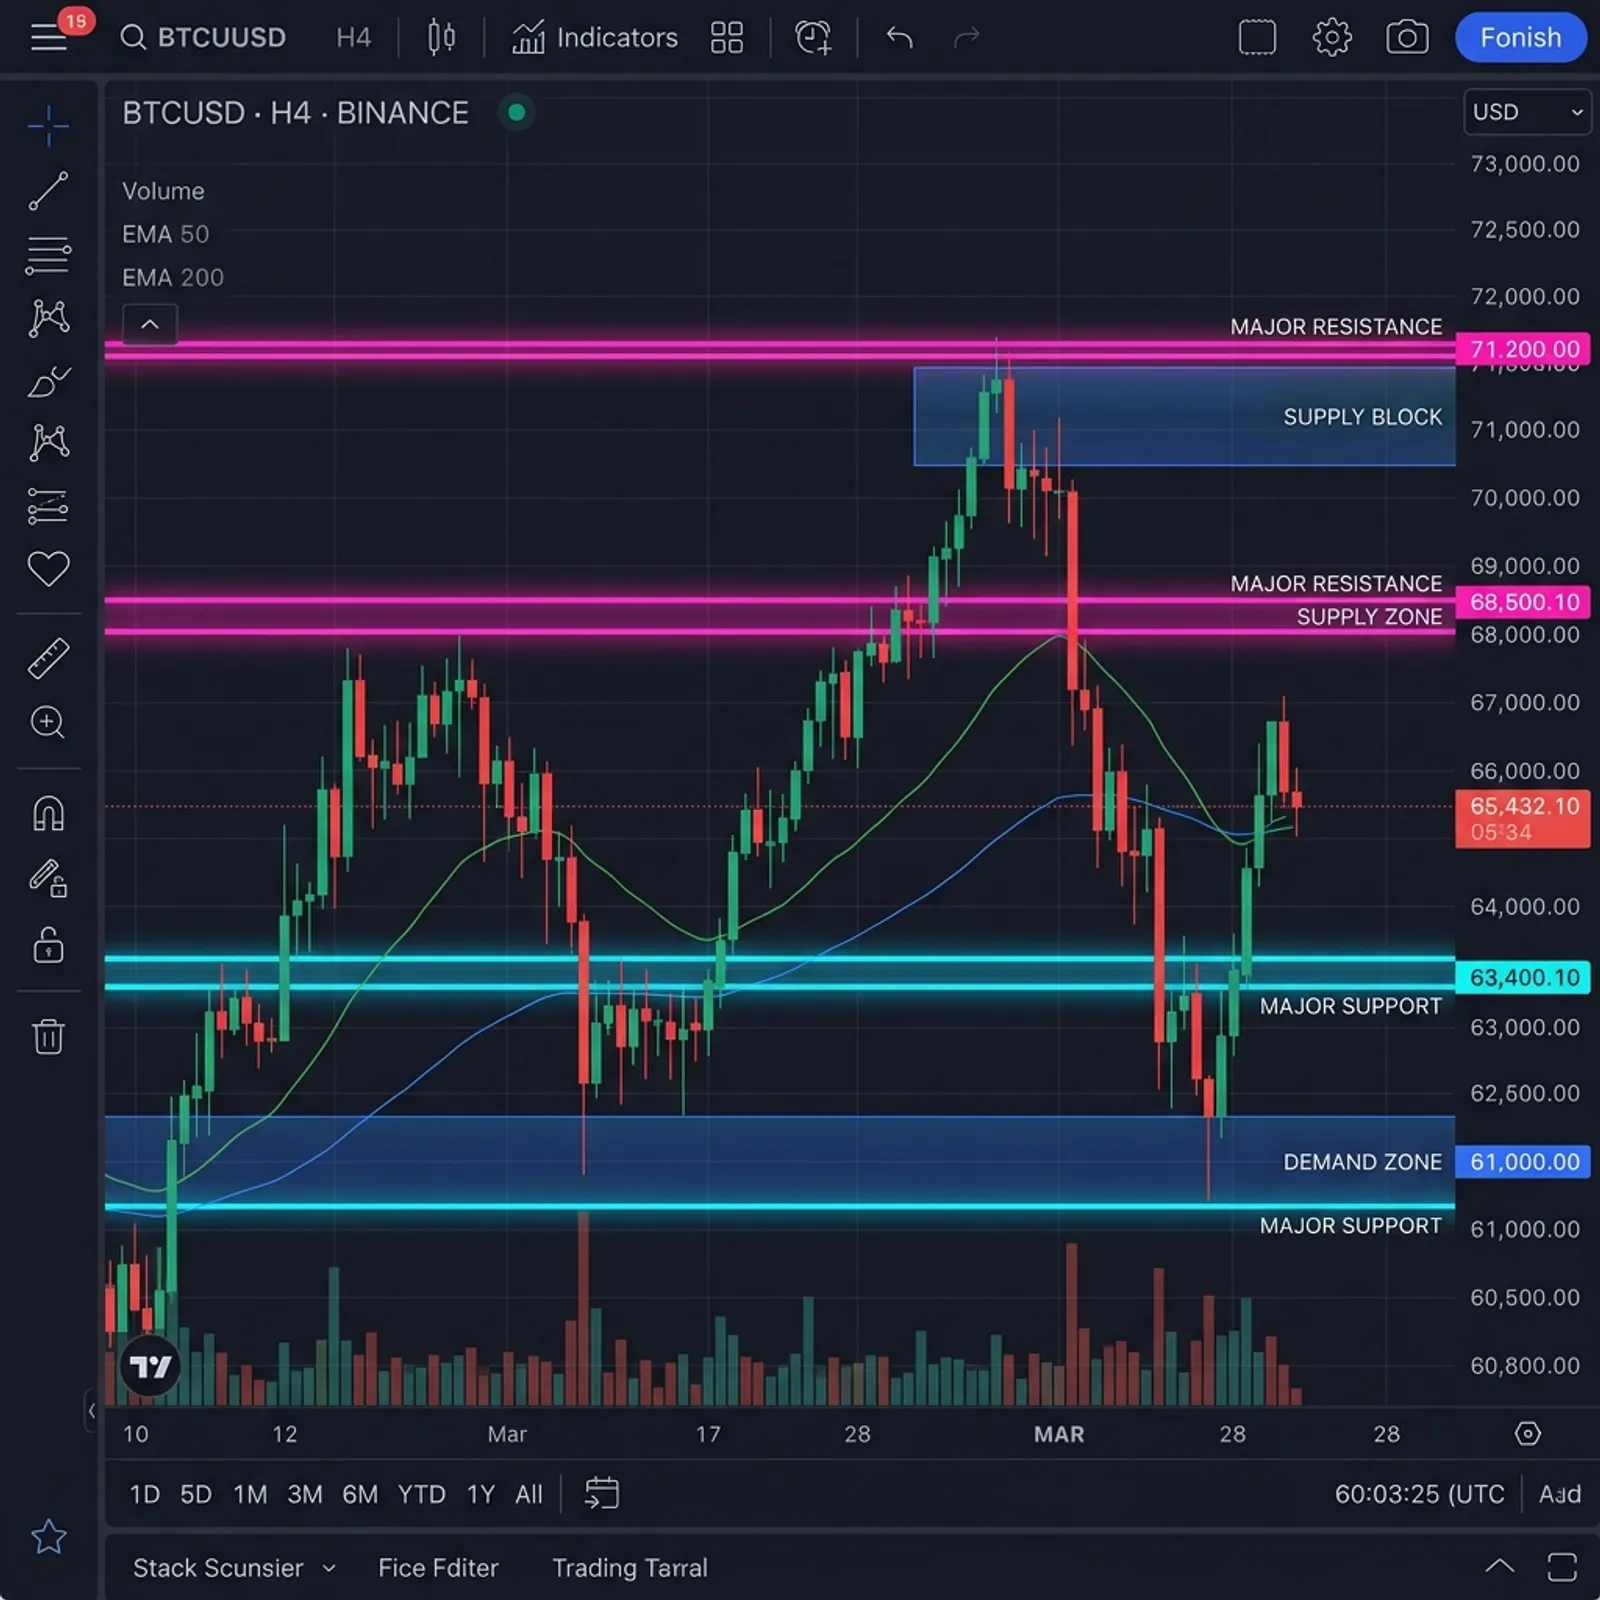
Support and resistance are historical price areas where buying or selling pressure repeatedly caused reactions.
Supply-demand zones are broader institutional-style interpretation layers where imbalance suggests strong resting intent.
Why These Levels Still Work
- Markets remember high-activity zones.
- Participants anchor orders around prior inflection points.
- Liquidity naturally accumulates near obvious levels.
They stop working when you over-mark everything and remove decision quality.
How to Mark Levels With Precision
Start With Higher Timeframe
Weekly and daily levels matter more than random micro zones.
Use Reaction + Displacement
A level that caused decisive movement is usually stronger than a level with weak bounce.
Keep a Zone, Not a Pixel Line
Treat levels as areas. Price often wicks through before deciding.
Practical Zone Workflow
- Mark two to four major higher-timeframe zones.
- Add current session highs/lows for intraday liquidity context.
- Build scenarios: bounce, break, sweep then reversal.
- Wait for confirmation in zone before entry.
- Remove zones that lose relevance.
Zone Type Comparison
| Level Type | How It Forms | Best Use | Main Trap |
|---|---|---|---|
| Classic Support/Resistance | Repeated historical reactions | Directional bias and targets | Overcrowding chart with minor levels |
| Supply Zone | Sharp sell-off origin | Short setup location | Shorting weak zones without confirmation |
| Demand Zone | Sharp rally origin | Long setup location | Buying zones in higher-timeframe downtrend |
| Session Level | Prior session high/low | Intraday liquidity map | Trading every touch without structure |
Common Mistakes
- Drawing too many levels.
- Treating broken support as guaranteed resistance without confirmation.
- Ignoring level quality (reaction strength, displacement, context).
- Entering before session liquidity tests complete.
FAQ
1. How many levels should I keep on chart?
Enough to make decisions, not enough to create indecision. Usually two to six major levels.
2. Are supply-demand zones better than support-resistance?
Neither is universally better. They are complementary frameworks.
3. Should I trade first touch of a level?
Only if your model supports it; otherwise wait for reaction confirmation.
4. What timeframe should define major levels?
Higher timeframes define them; lower timeframes refine entries.
5. When should I delete a level?
When repeated tests weaken it or structure context has shifted materially.
Conclusion
Clean levels create clean decisions. Mark fewer zones, demand confirmation, and let structure decide whether a level is worth risking capital.