Market Structure Explained for Traders Who Want Clear Rules
Understand highs, lows, trend states, and structural shifts with a practical framework you can apply before every trading session.
January 26, 2026 · 3 min read · by ChartzPayTheBillz
TL;DR: Market structure is the sequence of highs and lows that defines trend, range, or transition. It gives objective direction, better entries, and faster invalidation. If you cannot describe structure clearly, you are not ready to execute risk.
What Is Market Structure?
Market structure is the organized pattern of swing highs and swing lows that shows whether price is trending, ranging, or transitioning.
Structure is the foundation of discretionary trading because it answers one core question: is the market still doing what it was doing, or has behavior shifted?
Why Structure Is Non-Negotiable
- It removes emotional bias from entries.
- It prevents countertrend guessing.
- It provides objective invalidation.
Without structure, traders often confuse momentum candles with real directional change.
How Structure Forms in Real Time
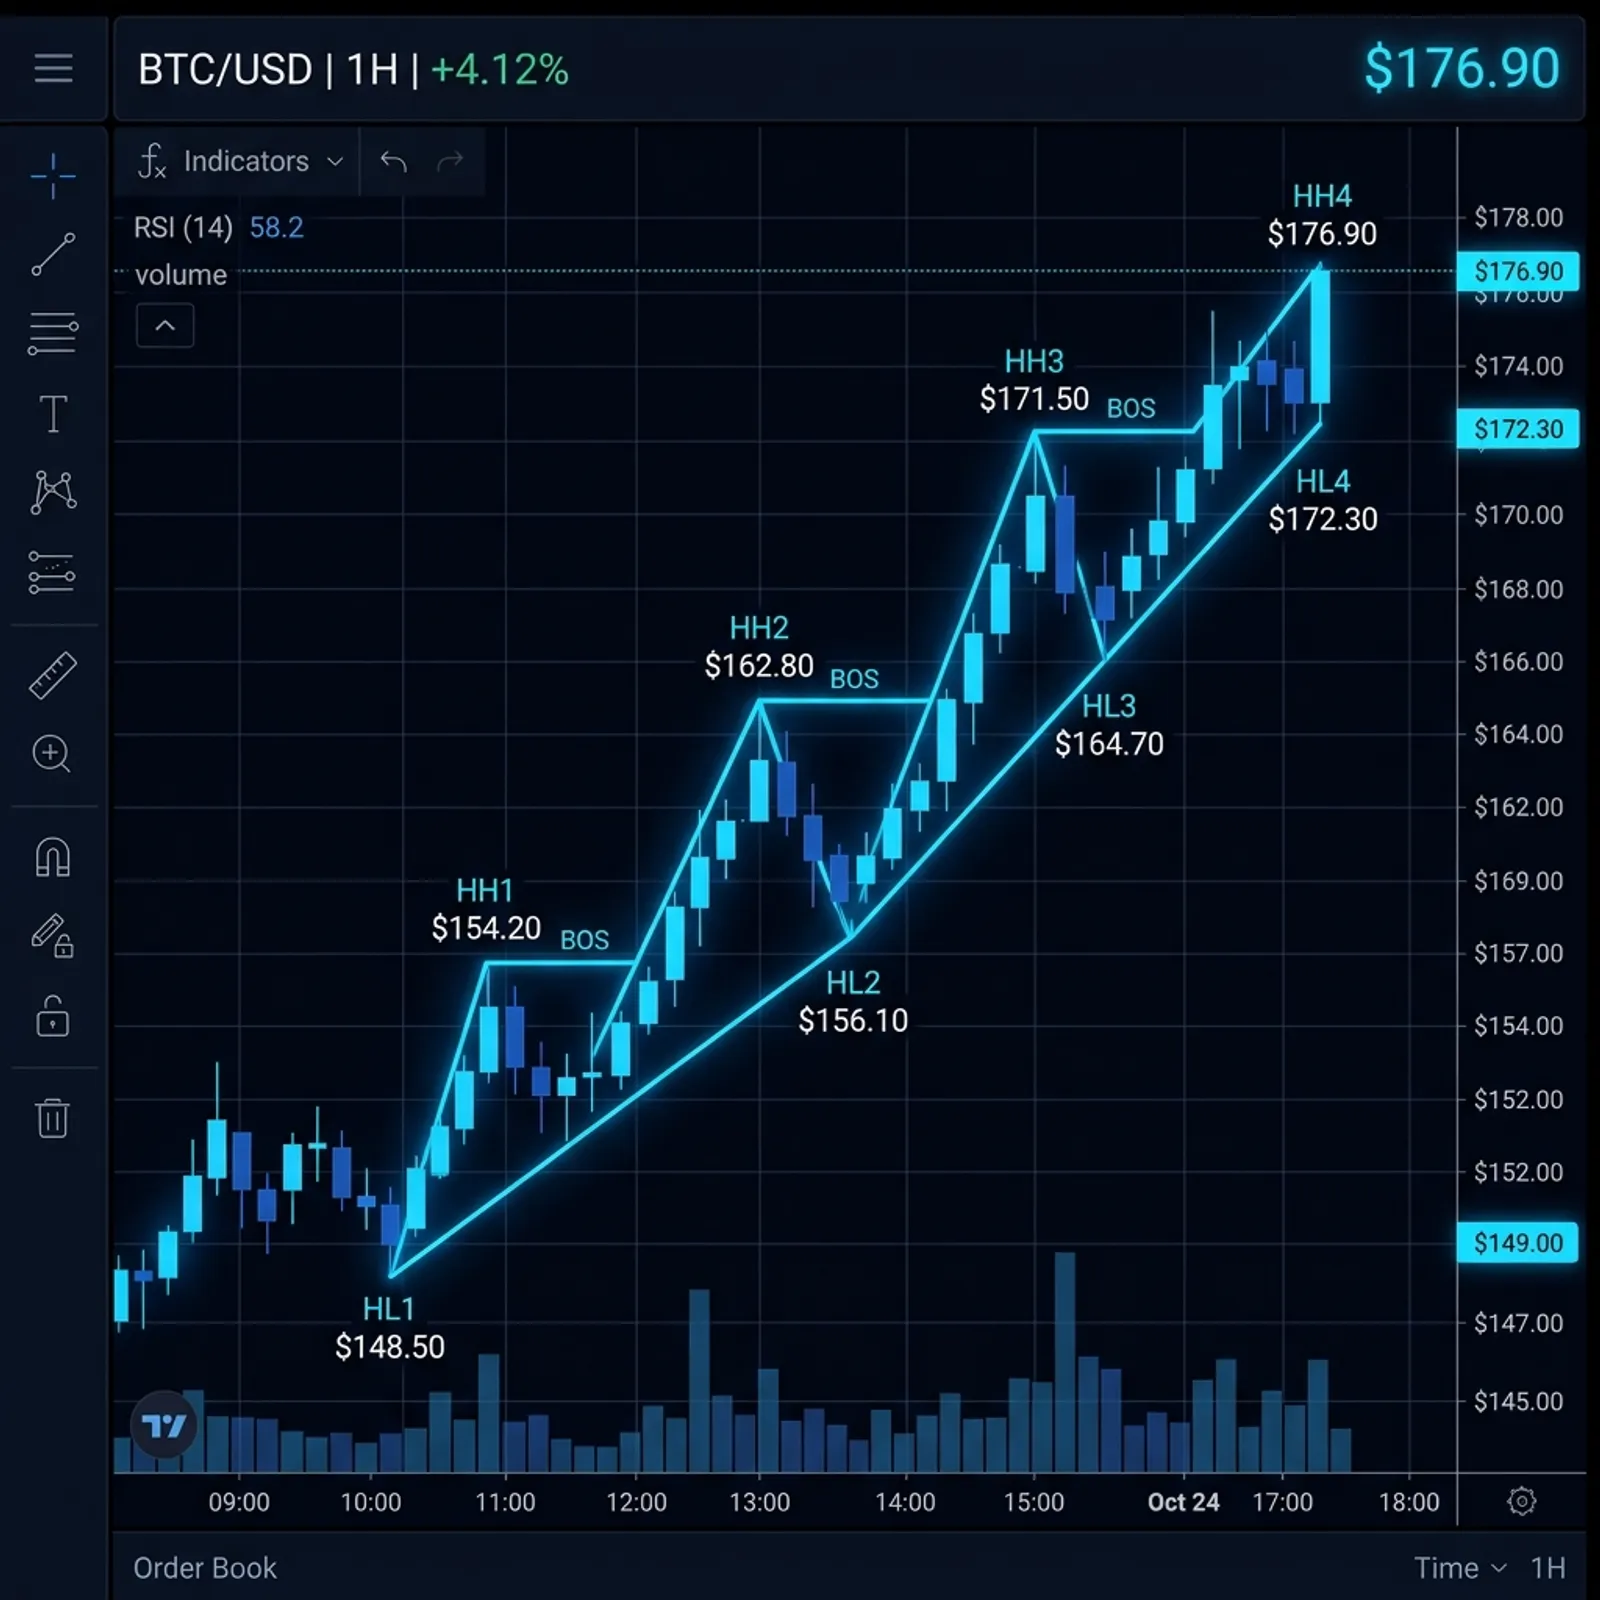
Uptrend
Higher highs and higher lows. Pullbacks should hold above prior structural lows.
Downtrend
Lower lows and lower highs. Rallies should fail below prior structural highs.
Range/Distribution
No clean progression. Price rotates between clear bounds while liquidity builds.
Transition
A break that holds, followed by failure to continue prior structure pattern.
Practical Structure Mapping Routine
- Mark significant swing points on higher timeframe.
- Label current state: trend, range, transition.
- Define what confirms continuation.
- Define what confirms invalidation.
- Execute only when lower timeframe aligns with higher timeframe map.
Structure State Comparison
| Structure State | Visual Clue | Trade Bias | Main Risk |
|---|---|---|---|
| Uptrend | HH + HL sequence | Buy pullbacks and continuation | Buying too late into resistance |
| Downtrend | LL + LH sequence | Sell rallies and continuation | Selling into major demand |
| Range | Equal highs/lows, rotation | Mean-reversion or breakout prep | False breakout traps |
| Transition | Pattern break + failed continuation | Wait for confirmation | Mistaking noise for reversal |
Common Mistakes
- Calling every impulsive candle a structure break.
- Ignoring higher timeframe when scalping.
- Entering before pullback confirms.
- Holding positions after structure invalidates.
FAQ
1. Is structure the same on all timeframes?
The logic is the same, but reliability changes. Higher timeframes usually carry more weight.
2. Can structure replace indicators?
For many traders, yes. Structure plus risk control can outperform cluttered indicator stacks.
3. How do I know a break is real?
Look for follow-through, hold/retest behavior, and failure of opposite-side reclaim.
4. Should I trade every structure break?
No. Trade breaks that align with context, timing, and acceptable risk-to-reward.
5. What is the fastest way to improve structure reading?
Replay charts and label swings daily. Consistent review builds speed and accuracy.
Conclusion
Market structure gives you direction, timing, and invalidation in one framework. Master it first, then add tools around it instead of replacing it.